
Scoring Chances
If you think about it, basketball is just a game of creating chances to score or eliminating those chances for the opponent. The quality of those chances that can be created, along with the talent of the players to put the ball in the hoop, with variation in size and side helpings of randomness on jump shots are really the biggest components to the final point totals in any given game.
You can be a good shooting team, create good shots, and have a bad night to result in a lackluster offensive performance or the complete opposite and the same goes for your opponent.
With all of that established and set aside, one of my favorite things to track is how many scoring chances a team actually gets. Due to offensive rebounds and turnovers for a team and their opponent it is not uncommon for one squad to have drastically more opportunities to score. Frequently it seems the best offensive teams in terms of efficiency are on the lower end of maximizing chances but they do sometimes coexist.
So which Big 12 teams give themselves the most opportunities for points in comparison to their opponent’s? See the table below for those results for Big 12 games only.
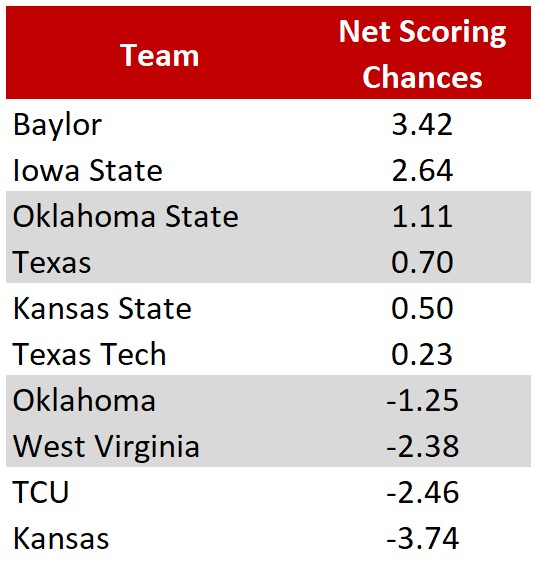
Iowa State is 122nd in adjusted offense on KenPom.com with middling numbers in rebounding at both ends, a lackluster turnover rate on offense, and an elite turnover rate on defense but in the end, it nets out in Big 12 games to two or three more opportunities to score than their opponent. That can obviously be a big deal in one or two-possession games.
However, it also obviously works in unison with scoring efficiencies but for a team that is nationally average in effective field goal percentage, it is a good start to come out on the positive side of this stat. It gives their offense more of a chance but it is also why their defense has been so strong in limiting scoring.
Gabe attacking
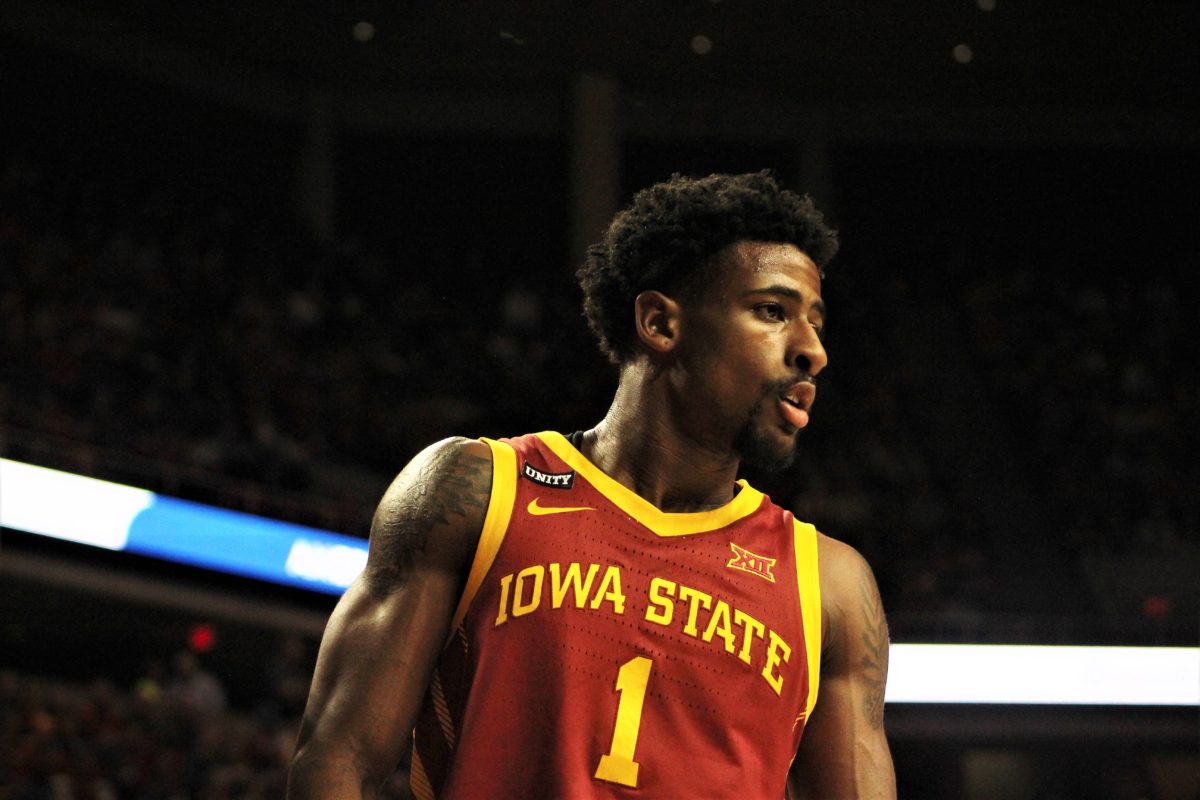
Since the woeful team performance on the offensive end against TCU, one of the biggest changes in how the offense has looked has been seen through Gabe Kalscheur. He is attacking the rim at his highest rate since the conference season started.
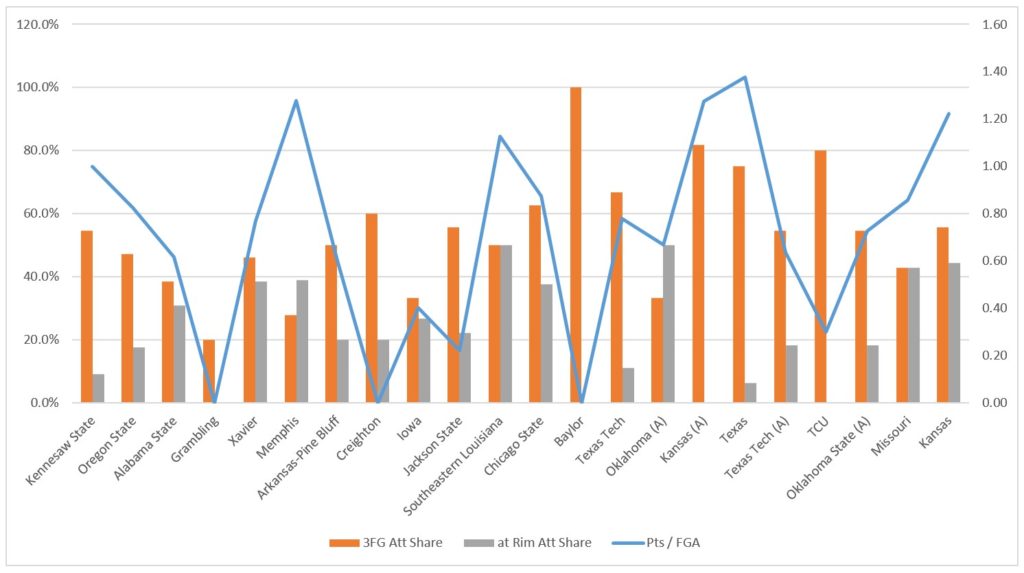
Below is the data backing it up… the orange bars are the percentage of his field-goal attempts that were outside the 3-point arc and the gray bars are the percentage of his attempts that came from near the rim, and the blue line goes with the secondary axis to show his points scored per field goal attempt. The game in Lawrence and the home game with Texas are really the only two outings where he was able to score efficiently from the field by going off from the 3-point line. Every other spike in scoring efficiency is supported just by him getting to the rim to attempt those close-range shots.
Brockington in the middle
The Iowa State offense was always going to be a work in progress but they have really shown flashes of ability to manufacture points with their defense and with their movement. When they haven’t been able to do that the Cyclones have relied heavily on Izaiah Brockington to put points on the board. As the season has worn on though, it has gotten more difficult for him to get to the rim thanks to scouting and him being a “one arm bandit” per Fran Fraschilla.
But just how much has the offensive output been tied to his mid-range success?
Below is a chart of all of Iowa State’s games against power six competition, sorted by highest team points per possession scored to least with the orange line, while the blue line is Brockington’s points per shot attempt from the mid-range, and the gray bars are the straight number of attempts to provide some further context.
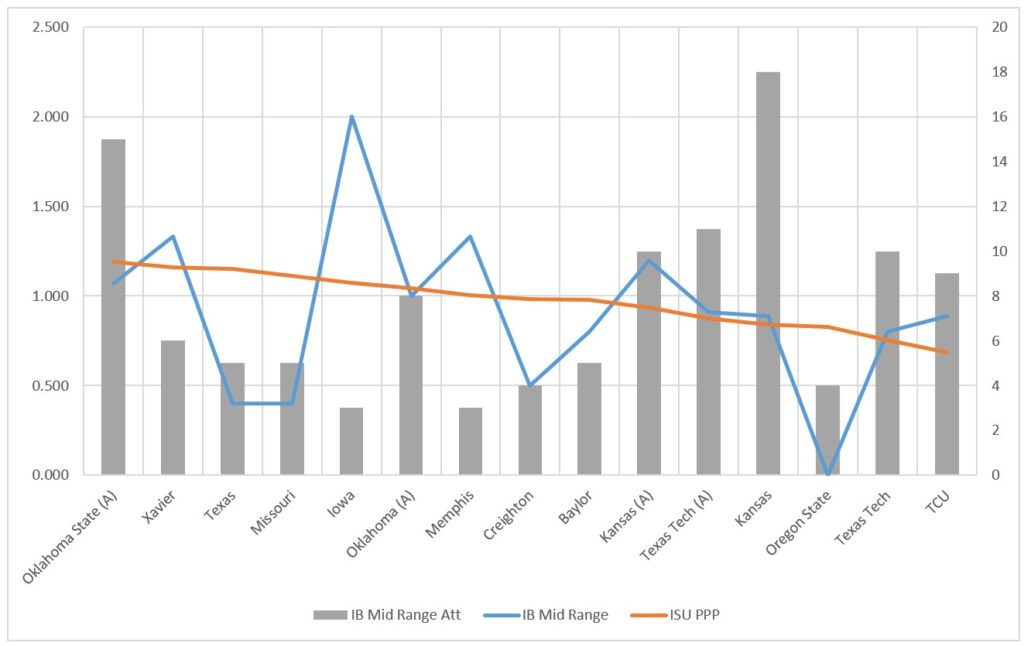
The team scoring is almost on top of the trend line for his scoring efficiency from this distance. In the last three games, we experience the high and low from a high volume of mid-range shots with an 8/15 outing in Stillwater and an 8/18 outing at home versus Kansas. In seven of the last nine games, he has attempted eight or more shots from the mid-range, which is honestly too many. I’m fine with mid-range shots but like everything in life, they require balance with the rest of the offense and must be evaluated with context.
Shot Selection
Per hoop-math.com, below is an expected value chart for each type of shot for each player along with the percentage of time that type of shot is taken. Brockington averaging 0.819 points per attempt in the mid-range isn’t exactly criminal when you consider the weaknesses of the offense and the workload that he is given but having 12 percent of the team’s shots being of that variety is probably too many.
All three columns showing the individual expected value of each shot are formatted together, the most efficient are red and the least efficient are blue. The same is true for the percentage of attempts columns. In a perfect world, your most valuable shots would be taken the most often but there are defenses pretty good at preventing those situations, especially in the Big 12.
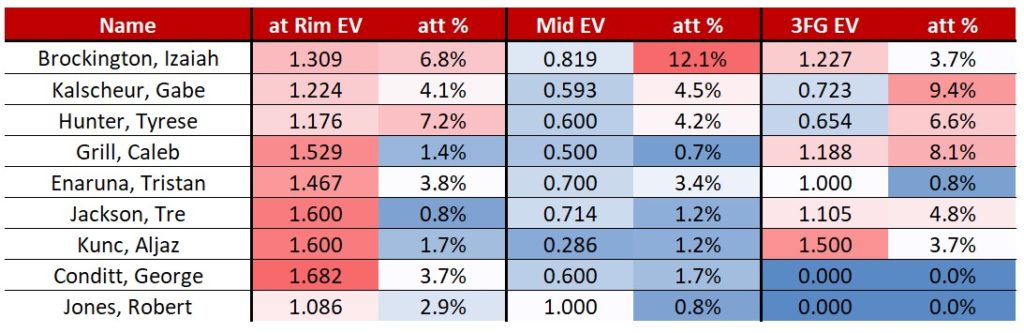
The captain obvious point here is that the shots at the rim have the highest value along with 3-pointers attempted by Brockington, Caleb Grill, Tre Jackson, and Aljaz Kunc, while Brockington’s mid-range shot is the most frequent shot taken. The crazy thing is that the expected value for 3-point attempts for him is second on the team so many of those long 2-point attempts could be evaluated differently if he took a step or two back to take them.
My other comments here are in regards to how the offense is operating to get these looks. I don’t necessarily love the number of times we see the horns sets but I can live with it if the players can execute a couple of required passes that come with tough angles. However, many times when they get into the dribble handoffs there is not enough player movement off the ball and the actions develop too slowly.
When they run their motion offense (so long as they don’t just throw it to the wrong team on ball reversals) they are constantly moving and causing the defense to move and react. So many times two or three reversals of the ball lead to a wide-open 3-point attempt from the wing or a lane to drive baseline and that is all due to the defense shifting and the quick ball movement.
Lastly, this roster makeup is really built off about 1.5 guys that can get to the rim off the dribble; Tyrese Hunter and Brockington if he gets an angle going to the left. Getting to the rim is so much harder against a set defense that doesn’t have to move, doesn’t have to see their man moving, and doesn’t have to see the ball moving. Offenses doing those three things can create advantages for guys to get to the rim that would otherwise not have them.
Rankings
The biggest thing when looking at rankings is we all need to understand what the ranking is for and how it is being calculated. There has been much consternation of Iowa State’s NET ranking but specifically their NET ranking in how it relates to Iowa. I get it, I personally don’t worry about it, but I get it.
In theory, the NET ranking is some unknown magical formula to homogenize performance rankings and resume rankings, but we really have no idea how. My two main thoughts on this…
It is clearly more tied to performance ratings that can be sorted out pretty quickly just by glancing at NET rankings compared to KenPom in contrast to how the NET rankings compare to a pure resume ranking like WAB (wins above bubble) is essentially the relative number of wins a team his against their schedule when compared to what an average bubble team would be expected to have. At this minute, Iowa State is #28 in NET, #25 in KenPom, and #20 in WAB.
What is interesting is that if you look at the top 30 NET teams the average variation in rank to KenPom is 3.03 while the average variation, when compared to WAB, is 8.07. So yes, NET leans heavier to a performance-based metric than a resume-based metric.
My 2nd beef is the quad win discussion. If a team has a win over the #1 team in the country on the road that is a quad one win just as a win over the #30 team at home is and those are two entirely different things that should be considered at more of a variable level. WAB on the other hand accounts for the variable data more effectively.
Whether we’re ranking team quality or team resumes when we get to March and deal with the selection committee these numbers can matter but we’re mostly at the mercy of a bunch of humans and whatever they want to rationalize, so, God speed!
Lastly, another shout out to the Twister Sisters who are tied atop the conference with Oklahoma at 8-2 and #10 in the country in their own NET rankings!


