Iowa State Cyclones’ guard Gabe Kalscheur (22) drives to the basket around Texas Longhorns’ guard Andrew Jones (1) during the second half at Hilton Coliseum Saturday, Jan. 15, 2022, in Ames, Iowa
Gabe & Grill
Our fearless leader, Christopher Williams, has recently posited that the Cyclones win more games than not when either Gabe Kalscheur or Caleb Grill plays well offensively. The sentiment could have been slightly different but I believe that was the main point. That doesn’t mean Iowa State can’t win if neither of those guys scores in double figures (they combined for 8 in the win over Iowa and neither got to 10 in the home win over Texas Tech) but I think his general line of thinking tracks.
So I looked into it quickly. And while he may have meant offensively as a whole, when we think of those two guys and how Iowa State has shot the ball this year my curiosity was most interested in how well they shoot the ball from the 3-point line and what that means for the offense.
Many times these statements are made in regards to “how do these guys do in wins or losses” but my preference is to isolate it to just Iowa State’s offense because their 3-point shooting really isn’t directly linked to the opposing team’s scoring rate.
Below is a chart with probably not enough sample but it is the sample size we have. The black line is Iowa State’s scoring output in each game in points per possession (ppp), the red line is the ppp on 3-point shots in those games for Kalscheur and Grill and the green line is the ppp on 3-point shots for the rest of the team.
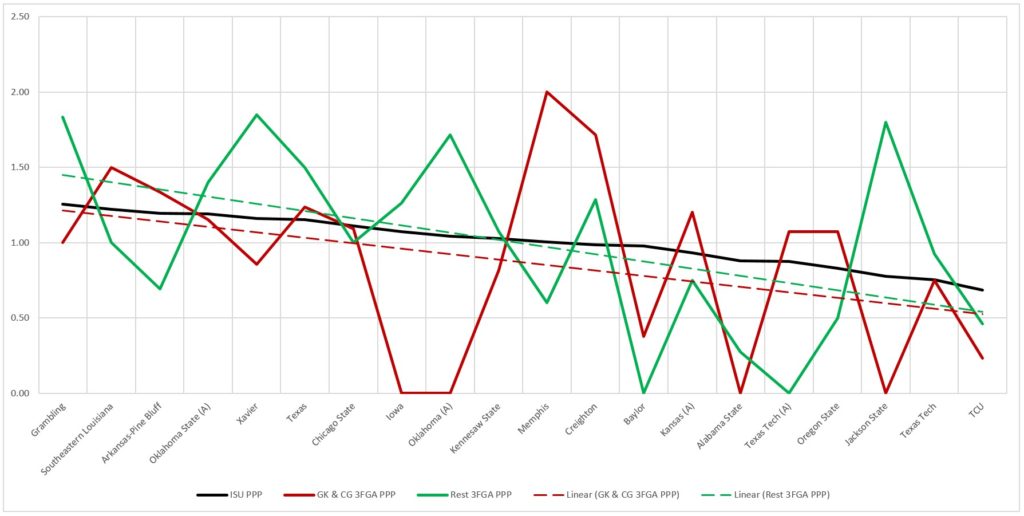
When I plotted Kalscheur and Grill’s line I wasn’t surprised. But I was surprised by the plot of the rest of the team. The difference is probably negligible and definitely not statistically significant but the primary takeaway here is that there is a slightly stronger link to the rest of the team’s 3-point efficiency and Iowa State’s overall scoring than just that of Kalscheur and Grill. Though, I still hope they make a million more 3-pointers this season.
Mid-Range vs at the Rim
ANOTHER LINE CHART!
It really isn’t a secret anymore that the Cyclones (read: Izaiah Brockington) shoot A LOT of mid-range shots. But how does the share of overall field goal attempts coming from each range impact scoring?
It is worth noting that play by play can be a bit sketchy at attributing these shots by distance and in this case, anything between about five feet away and a toenail on the 3-point line falls in the same bucket of “mid-range”… but, it is what I have to work with. More detailed differentiation would likely produce better results even if it reduced the sample size in each bucket.
The red line below is each game’s percentage of shots from “at the rim” and the green line is the percentage of shots for longer 2-point attempts. It isn’t a surprise that just the share of attempts would be linked to the overall ppp for the Cyclones in each game. The visual that I like from this is that the red line needs to be above the green line to feel good about how the offense played, regardless of how many stone-cold long 2-point jumpers Brockington drilled in Stillwater this week.
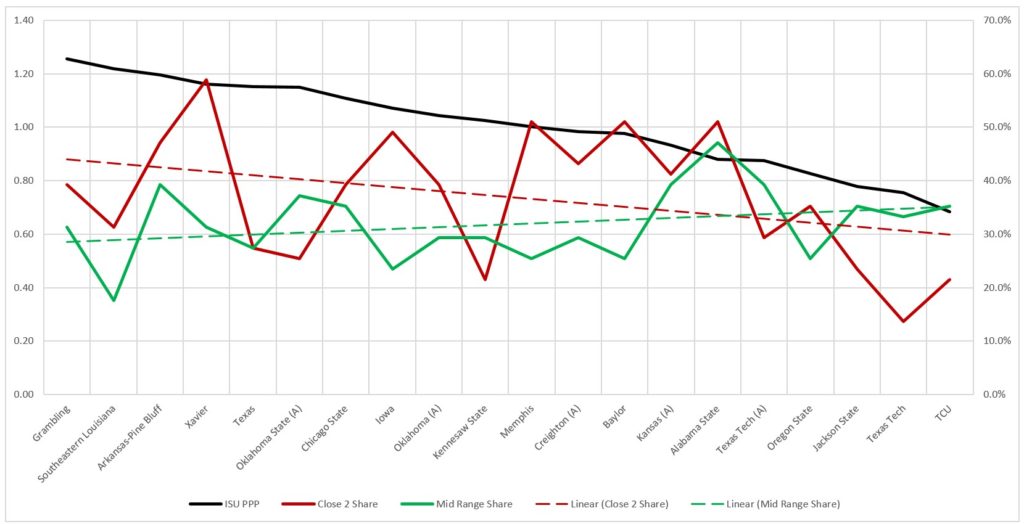
That thought process marries up pretty well with the conditions that produced some rough offensive games, both outings versus Texas Tech, Jackson State, and TCU.
Offensive Rebounding and PPP
When I try and dig into data that supports scoring, for instance, I like to look for underlying stats that seem to be linked. Hence, my diatribe on assist rate a few weeks ago.
Did you know that the Cyclones scoring output has a stronger link to offensive rebounding than their turnover percentage, free throw rate, steal percentage, or opponent turnover rate?
Another line chart for proof.
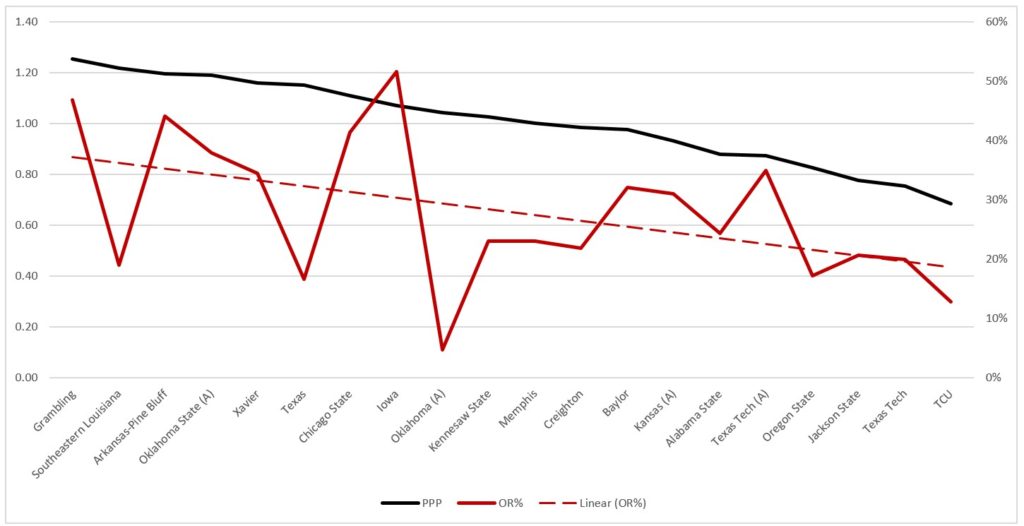
There is data out there about the value of offensive rebounding and how it supports scoring due to the scramble situations for close put backs or kick-outs to the perimeter and it seems to hold true for this group when they are struggling to put the ball in the hole on the first try.
P6 vs Non-P6
All of this slicing of offensive stats in various ways got me to wondering how much impact was being caused by the type of competition. In reality, it probably would have been better to sort it out by KenPom adjusted defensive efficiency but really the only P6 school outside the top 100 defense is Oregon State (at 236!!) and Iowa is the only one drastically outside of the top 50.
But, what happens when you separate out some of these key offensive stats by power six league competition and smaller schools? (Also note that Iowa State has basically only played top 50 teams or bottom 100 teams, especially defensively, so this is likely exacerbating the split here.)
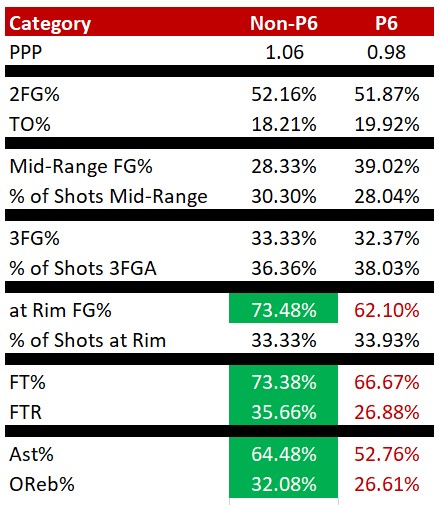
You can see the drop in ppp from non-P6 teams to P6 opponents but what I find most interesting is that a lot of what I would have expected to be a key indicator is basically flat between the two buckets. Turnovers, 2-point percentage, mid-range data, 3-point percentage, and 3-point attempts.
The primary stylistic things that have dropped against the tougher competition (likely as expected?) are the percentage of makes on attempts at the rim, free throw rate, assist rate, and offensive rebounding rate.
As the season has progressed and the competition has been voided of the bottom 100 teams and scouting has improved, these areas have been hit the hardest and they logically check out when you consider the competition being played. The free throw percentage decrease is a bit random but outside of that, I think the two things most under Iowa State’s control from this group of numbers that can be improved upon are the free throw rate and offensive rebounding.
Perhaps improving those would lead to more consistent offensive performances.
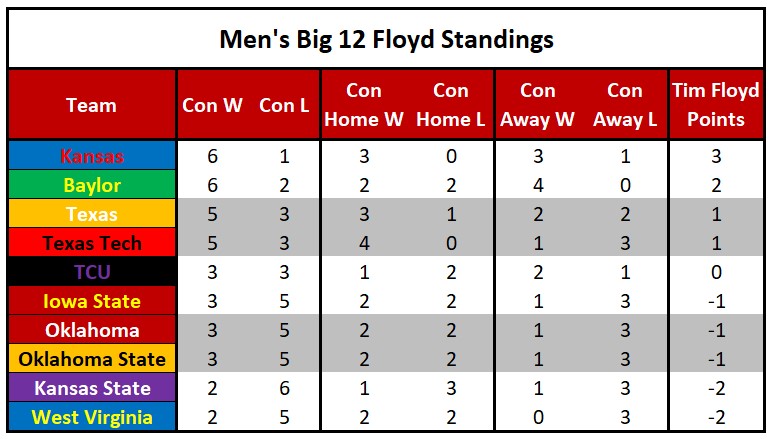
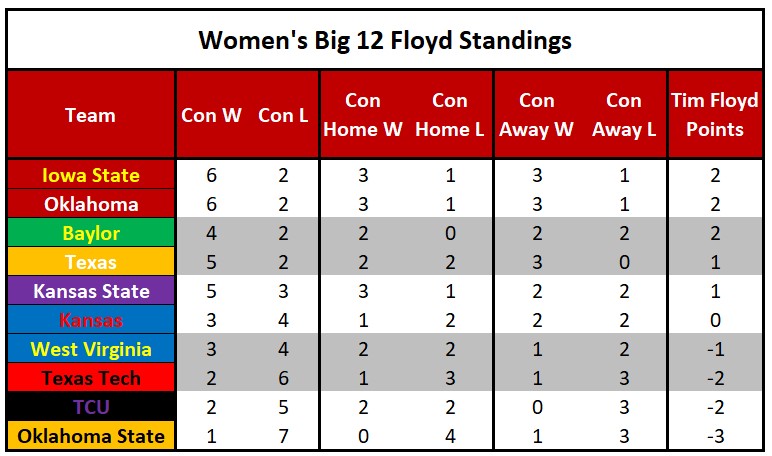
Floyd Standings and the Schedule Matrix
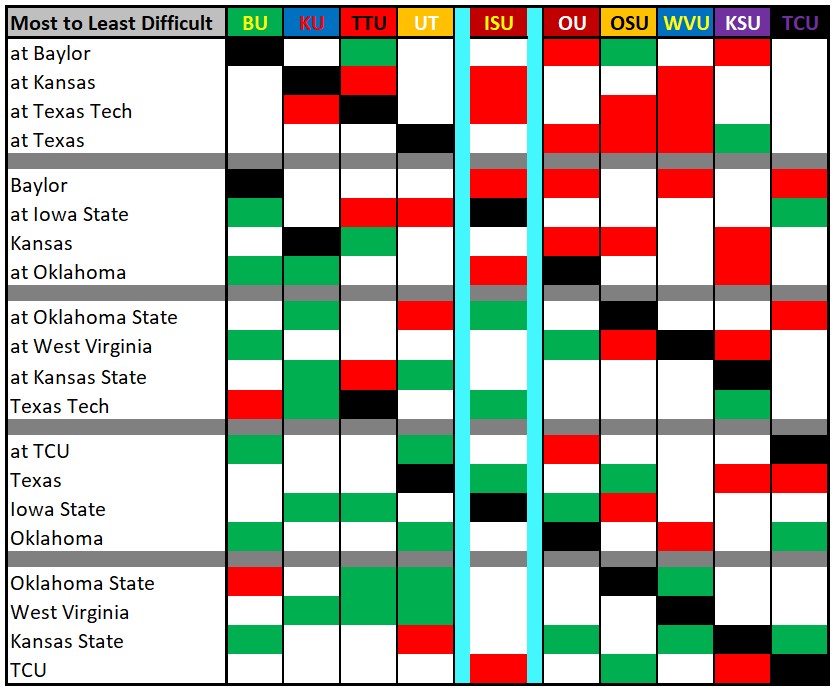
Below are the Tim Floyd Standings for the Big 12 men’s and women’s race (+1 for a road win and -1 for a home loss).
Here is the updated chart on games played for each team listed from most difficult to least with the results. The next three for the Cyclones are hosting Kansas and then traveling to Texas and West Virginia which are top half in terms of difficulty for ISU. From there out they will play six of the seven “easiest” games of the Big 12 season before wrapping up with the most difficult game in Waco. That is the stretch that will really project the Cyclones into the post-season.