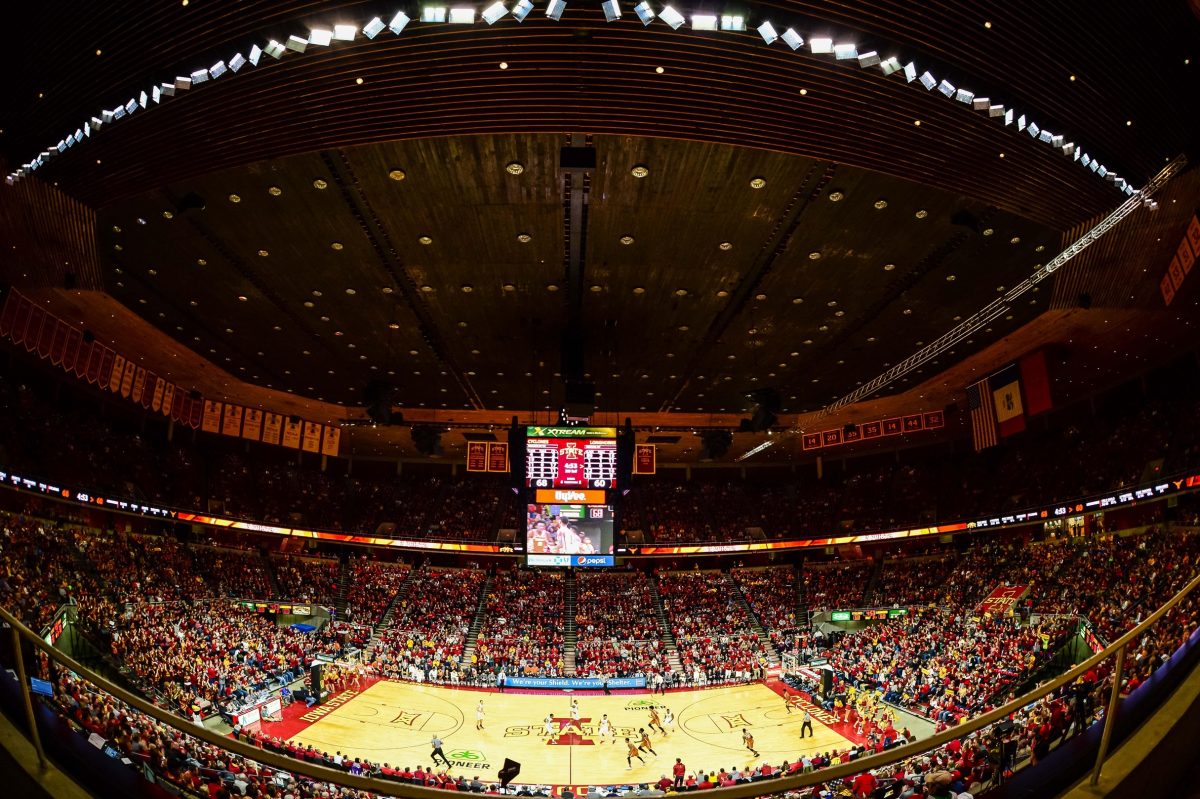
Jan 7, 2017; Ames, IA, USA; A general view of Hilton Coliseum during the game between the Iowa State Cyclones and the Texas Longhorns. Iowa State won 79-70. Mandatory Credit: Jeffrey Becker-USA TODAY Sports
PROJECT CREDITS:
Seeding research: Kirk Haaland (who also wrote the below explanation)
Seeding assistance: Brent Blum
Tech/Bracket work: Jared Stansbury
How do you rank nearly 500 players over the course of 65+ years to objectively find the greatest Cyclone basketball player of all time?
In short, you don’t. But there is no fun in that.
The next best thing is obviously to create a quasi-close 1-64 ranking of the Cyclone Legends of Hilton Coliseum, throw them in a bracket, and let you the Fanatics vote round by round of which player was “better.” That has a different meaning for everyone. Was it the guy that scored the most points, won the most games, had the most success in the NCAA Tournament, did the dirty work on the court, or signed an autograph for you as a kid?
That is your call on how you rate their Cyclone career.
However, let me outline the method to how each player got his seed and how this bracket was created. I created an algorithm that had three main components; team success, individual scoring, and all other stats but a longevity bonus was also applied based on the number of seasons a player hung around Ames.
Scoring – This was done simply using each players points per game average and their effective field goal percentage. I initially wanted to use percentage of team points scored to account for tempo (keep in mind that data isn’t available to calculate possessions so that wasn’t an option) but found it was affected by too many other factors. The primary one being guys that were the only scoring threats on bad teams were elevated what seemed to be too high.
All other stats – This is comprised of rebounds per game, assists per game, blocked shots per game, steals per game, and turnovers per game. Again, I wanted to use the percentage of each stat but ran into similar problems as with scoring. But the other major issue was that all of these stats were not available for all of the players under consideration.
Rebounds weren’t recorded until 1953, assists weren’t recorded until 1973, blocked shots and steals in 1979, and turnovers weren’t recorded until 1982.
That basically means that some guys that played without having those stats to boost their overall player rating had to be manually adjusted for using other methods. As you can imagine, that got a bit convoluted but in the end, I think the bracket looks pretty decent. If anything, it is probably too favorable to more recent players.
Team success – This was done simply by considering the player’s career win percentage in conference games played and their career NCAA Tournament games won. Conference win percentage is the best way to try and compare eras where you will more than likely get a relatively similar landscape year to year in strength of competition.
These three categories were then weighted and combined and I repeat, in a mostly convoluted way, with a longevity bonus thrown in to then get a ranking of players 1-64. From there, a few procedural bumps were doled out to guys that had fewer stats recorded so that they’d be on more even ground. These were done on a case by case basis and approved by the Judge and Jury, Brent Blum.
In the end, this is an impossible task. But in the end I’m pretty happy with how the bracket turned out overall.
If you’re curious, here are the first four out that missed the bracket:
Chris Babb (2011-13), Al Koch (1963-66), Tom Schafer (1985-87), and Abdel Nader (2014-16).
And, the next four out:
Wesley Johnson (2006-08), Jiri Hubalek (2005-08), Terrence Allen (1980-84), and Chris Allen (2011-12).


