Most of west Ames was under 3.5 according to that site, but I did see 3.8 right after Boone county. I think part of that might still be in the Ames city limits but not sure.This site had some +3.80" recorded on the west side of Ames. Often higher amounts are averaged out in the model. Not unrealistic that some 4" plus amounts have been reported in the area.


No forums found...
Site Related
Iowa State
College Sports
General - Non ISU
CF Archive
Install the app
How to install the app on iOS
Follow along with the video below to see how to install our site as a web app on your home screen.
Note: This feature may not be available in some browsers.
***Official 2022 Weather Thread***
- Thread starter wxman1
- Start date
No forums found...
Site Related
Iowa State
College Sports
General - Non ISU
CF Archive
You are using an out of date browser. It may not display this or other websites correctly.
You should upgrade or use an alternative browser.
You should upgrade or use an alternative browser.
This site likely operates the same as Climate FieldView. They essentially take data points and then use an overlay to smooth a general area depending on those points. They can be generally close but also wildly inaccurate at times. It really just depends where the data source is in relationship to where you're seeking data for and how sharp the gradient is. In a year like this year 1 mile could be the difference between 2 inches of rain. However they are generally a good way to tell if a general area got a lot of rain, or a little rain.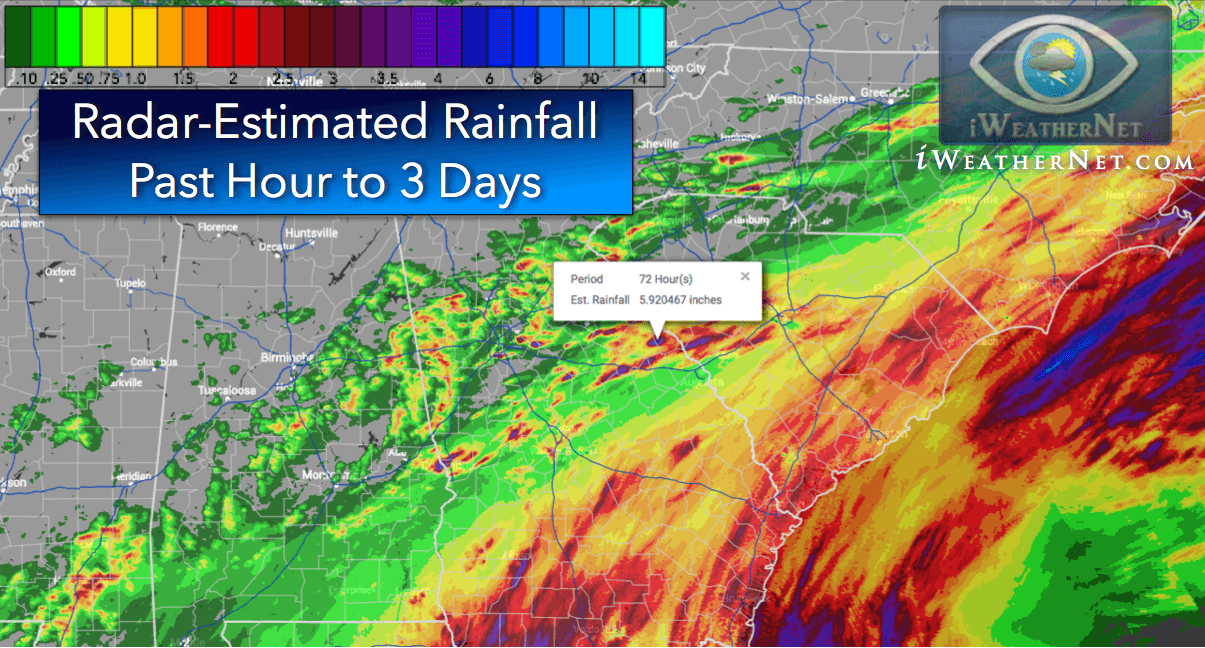
Rainfall totals for the last 24 hours to 3 days - high resolution map
Radar-estimated precipitation accumulation for the past 24 hours to 3 days. High resolution and interactive rainfall data on Google Maps.www.iweathernet.com
This site nailed the amount in my gauge this am. 2.85"
For example, I dropped a pin on my house and it says 3.27" and my gauge this morning had right at 4". I'm assuming there is a data point around the research farm West of town and at the Airport, so seeing how the totals drop off to the East side of town it makes sense that my average would appear lower due to the smoothing overlay.
Last edited:
This site likely operates the same as Climate FieldView. They essentially take data points and then use an overlay to smooth a general area depending on those points. They can be generally close but also wildly inaccurate at times. It really just depends where the data source is in relationship to where you're seeking data for and how sharp the gradient is. In a year like this year 1 mile could be the difference between 2 inches of rain. However they are generally a good way to tell if a general area got a lot of rain, or a little rain.
For example, I dropped a pin on my house and it says 3.27" and my gauge this morning had right at 4". I'm assuming there is a data point around the research farm West of town and at the Airport, so seeing how the totals drop off to the East side of town it makes sense that my average would appear lower due to the smoothing overlay.
It uses radar estimated rainfall for what it's worth.


You're a monster.Best time of the year!!! Bring it on!


Someone tell Timmer there is a Cyclone warning in Ames early Saturday afternoon. He should skip the game in Lincoln....
Someone tell Timmer there is a Cyclone warning in Ames early Saturday afternoon. He should skip the game in Lincoln....
He’s OU alumni.