Offensive and Defensive Line Trends CMC Era

cymonw1980

Well-Known Member
SuperFanatic
SuperFanatic T2
Nov 23, 2015
865
1,430
93
Raleigh, NC
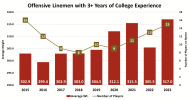
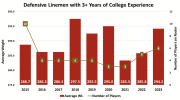
I took a look at the OL/DL position based on the rosters posted on cyclones.com over the past 9 years (2015-2023).

I filtered the data on Linemen with 3+ years of experience (Jr/R-So or Older). This eliminates our largest DL Orange since he is a true Sophomore.

The DL data includes DL/DT but does no include DE.

I thought the data was interesting. We will have some of our largest and most experienced lines in the Campbell era on both sides of the ball. We will see how it goes...
1690308079194.png


1690308095334.png
 
Last edited:

Aclone

Well-Known Member
Dec 14, 2007
24,548
16,629
113
Des Moines, Ia.
I was working on a piece about why the two units have trended so differently through Campbell’s tenure.

The short answer is that he hit on recruits right off the bat on the DL (JaQuan, Enyi, and Jamahl Johnson—followed immediately by Ray Lima) allowing that group to take off fairly quickly. The OL, not so much.

That effect only exacerbated by needing only three DL vs five OL.

Recruiting really does matter.
 

cymonw1980

Well-Known Member
SuperFanatic
SuperFanatic T2
Nov 23, 2015
865
1,430
93
Raleigh, NC
I also think the fact that a glorified GA with no experience was the OL coach didn't help at all.
Yes… I think there were multiple factors that impacted o-line production. Part recruiting, part development.

Hoping the new O-line coach + the new S&C director will solve the issues. Maybe with the experience and size in the room it goes faster than we think. Maybe he will need a couple years… we will see.
 

FLYINGCYCLONE

Well-Known Member
Aug 27, 2022
593
473
63
67
LuVerne Iowa
The O Line plays 5 and the D Line plays 3 or 4, so that is part of the difference. Also injuries play part of the difference. Seems to me that we have had more injuries on the O Line?
Again Thanks for the great info.
 

CascadeClone

Well-Known Member
Oct 24, 2009
9,099
10,989
113
OP, thanks for putting up some interesting data points. From a "moneyball" perspective, I'd be curious what types of stats are most correlated with predicting OL success?

WSJ did a study years ago and returning starts wasn't very correlated to good OL play IIRC. Mostly because you could have returning starters who just aren't that great to begin with. Also, you could have an All-Conference returning junior, who maybe only has a handful of starts, but would give you a much better line than a 2-star senior who has just hung around forever and is "serviceable".

I wonder if you could take returning starts, along with stars (maybe assign returning all-con players as 5-stars) and would that be better predictor? You could also take years in the program and maybe even just weight as independent variables too. And do a data regression on all of them.

Which then begs this question: what outcome stats do you use for OL success? YPA? YPR? Sack rate? Penalties? There's a bunch of more exotic stats as well (e.g. opportunity rate, power success rate)

Edit: looks like Adjusted Line Yards and Adjusted Sack Rate are the 2 best "outcomes".
 
  • Like
Reactions: cymonw1980

cymonw1980

Well-Known Member
SuperFanatic
SuperFanatic T2
Nov 23, 2015
865
1,430
93
Raleigh, NC
OP, thanks for putting up some interesting data points. From a "moneyball" perspective, I'd be curious what types of stats are most correlated with predicting OL success?

WSJ did a study years ago and returning starts wasn't very correlated to good OL play IIRC. Mostly because you could have returning starters who just aren't that great to begin with. Also, you could have an All-Conference returning junior, who maybe only has a handful of starts, but would give you a much better line than a 2-star senior who has just hung around forever and is "serviceable".

I wonder if you could take returning starts, along with stars (maybe assign returning all-con players as 5-stars) and would that be better predictor? You could also take years in the program and maybe even just weight as independent variables too. And do a data regression on all of them.

Which then begs this question: what outcome stats do you use for OL success? YPA? YPR? Sack rate? Penalties? There's a bunch of more exotic stats as well (e.g. opportunity rate, power success rate)

Edit: looks like Adjusted Line Yards and Adjusted Sack Rate are the 2 best "outcomes".
Yes original plan was to augment this data with things like All Conf data, starts, recruiting rank, number of P5 offers, PFF grades, snaps played… etc.

But have not had time to compile additional data yet. If I get a chance to add the rest of the data I will post it. But kids and work take priority… so will get to it if I can.
 

Latest posts

Help Support Us

Become a patron