Iowa State Cyclones’ guard Tyrese Hunter (11) lays up the ball around Texas Longhorns’ guard Courtney Ramey (3) during the second half at Hilton Coliseum Saturday, Jan. 15, 2022, in Ames, Iowa.
Offense vs Texas
The biggest takeaway from the Texas game other than Chris Beard not knowing what “unanimous” means was the Iowa State offense logging their second-best scoring outing against a P6 team this season by recording 1.14 points per possession (PPP) in the win over the Longhorns. Only the Xavier game was a more prolific scoring game, checking in at 1.16 PPP.
It also marked the second-highest scoring rate the Longhorns have allowed this season, only Gonzaga scored at a higher raw rate with 1.33 PPP.
Thanks to barttorvik.com, where you can review game by game offensive and defensive efficiencies that are adjusted for strength of opponent we can also see that it was a stronger scoring performance than the game vs Xavier because of the Longhorn defense being #16 on Torvik and #18 on KenPom.
The two biggest reasons for the outburst were Gabe Kalscheur who went off for 22 points on 6-for-12 shooting from behind the 3-point line. It was Kalscheur’s second-best performance by offensive rating at 116 (behind only Memphis) but was done rather efficiently with only a slightly higher than his average usage rate of 25 percent. He still had two turnovers but those have been a bugaboo for him all season with only two games where he has had fewer.
The other big reason for the offensive performance of the team was the play of the freshman point guard, Tyrese Hunter. Hunter earned his first KenPom MVP of his college career and notched his best offensive rating of the season at 131.
Tyrese and turnovers
But how good has Tyrese been? I present two charts…
First, if he has had any failings this season it has been with turnovers and perhaps 3-point shooting—but at his shot volume, his 3-point percentage isn’t awful, though an improvement would take his game to a very high level. But his 24 percent turnover rate has been his biggest battle of the season that can be improved as we move forward.
Below is a chart of all high major freshmen that average at least 20 minutes per game. This isn’t excluded to just point guards but we’re plotting his usage rate (x-axis) to his turnover rate (y-axis) in comparison to all other P6 freshmen.
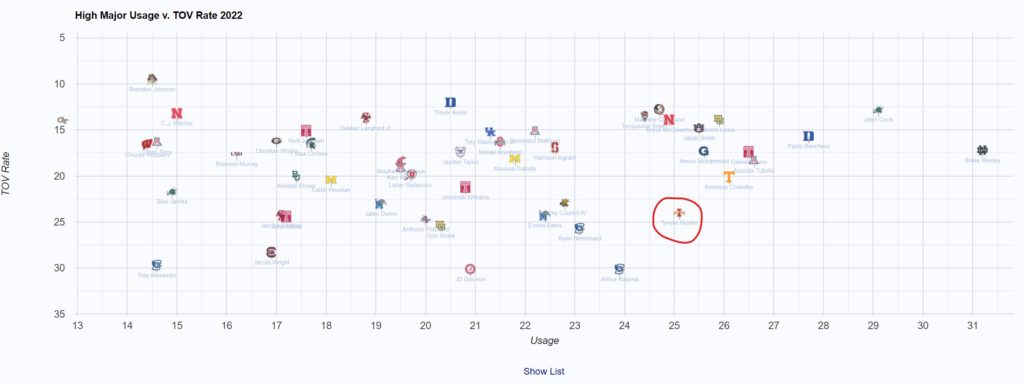
Regardless of how bad his turnover rate has maybe been, it is really not out of line.
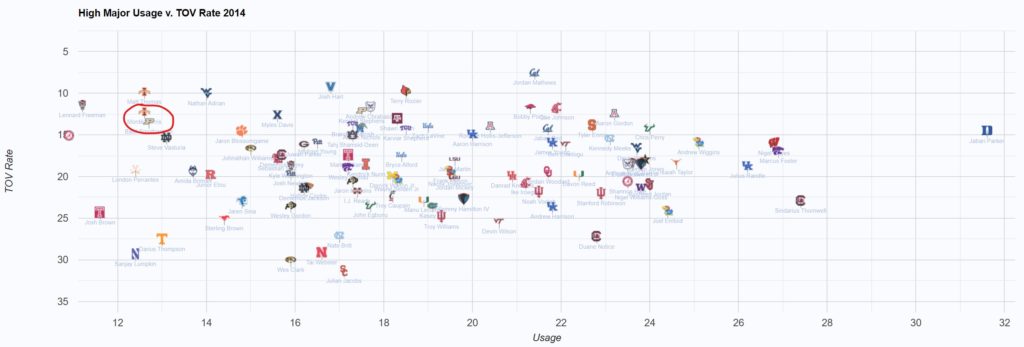
For reference, compare this chart to the same group of freshmen in 2014. Yes, Monte Morris had half the turnover rate but he also had half the usage while being surrounded by a lot more offensive talent. A lot more. In fact, Monte Morris never had a usage rate above 20 percent until his senior year.
Now let’s look at his assist rate (x-axis) and compare that to the turnover rate.
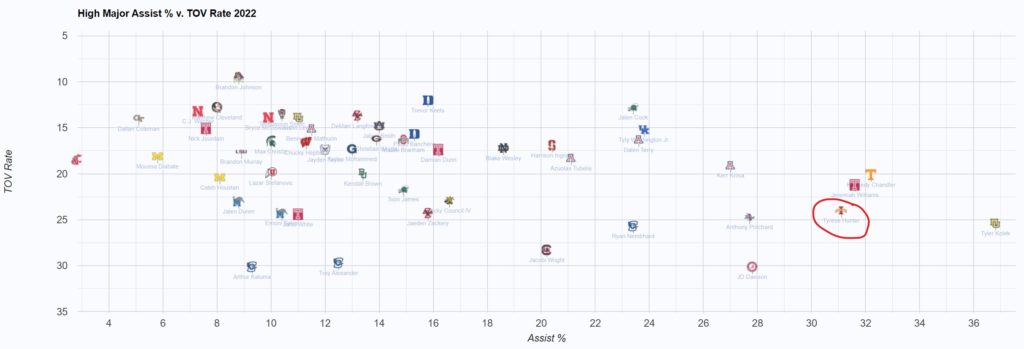
The point is that while his turnovers need to get better and they are, in the grand scheme of things they are really not too far out of line with the load he has to carry and he has the fourth-best assist rate of P6 freshman playing 20 minutes per game.
Texas Tech and Free Throws
I don’t just want this to be a continuance of complaining about the three guys wearing black and white stripes in Lubbock on Tuesday night (though I have some) but I do want to highlight the largest area of improvement for the Cyclone defense that is currently 4th in the NCAA as of right now. Iowa State currently has a defensive free throw rate (opponent free throw attempts/opponent field goal attempts) that is 314th in the country, their worst ranking in this stat in the KenPom database back to 1997!
What is the practical negative result of fouling too much? You need to look no further than Tuesday night to see what can happen—again without debating the legitimacy or fairness of the fouls that were called.
On Tuesday night in Lubbock, Texas Tech scored at 1.05 PPP, the second-highest scoring rate that Iowa State has allowed this season. In the game, the Cyclones were called for 28 fouls and Texas Tech attempted 38 free throws. On possessions that did not include trips to the free-throw line, the Red Raiders scored 0.85 PPP. That was the fifth-highest allowed this season but really not far from the average of 0.77 this season. On possessions where Tech went to the free-throw line (and one situations excluded), they scored 1.61 PPP.
Opponents this year average 1.47 PPP on possessions that go to the free-throw line, so again, their make percentage wasn’t wildly out of line but what needs to be prevented is the volume of trips to the free-throw line. Good whistle or bad whistle, the free throw rate has to come down.
The two highest opponent free throw rates in the last 20 years have happened this season (Kennesaw State at 78.3 and the road game at Texas Tech at 82.6).
Updated schedule matrix
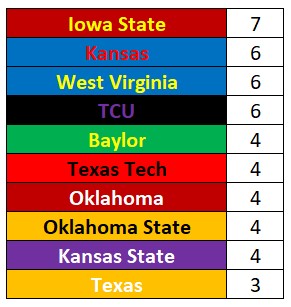
Updated from last week is the schedule matrix that I made. The games are listed in the far left column in Big 12 play from most difficult to the least, and each column shows the given team’s results in those games. Green for a win, red for a loss, and yellow if that game is in the next four league games for the given team.
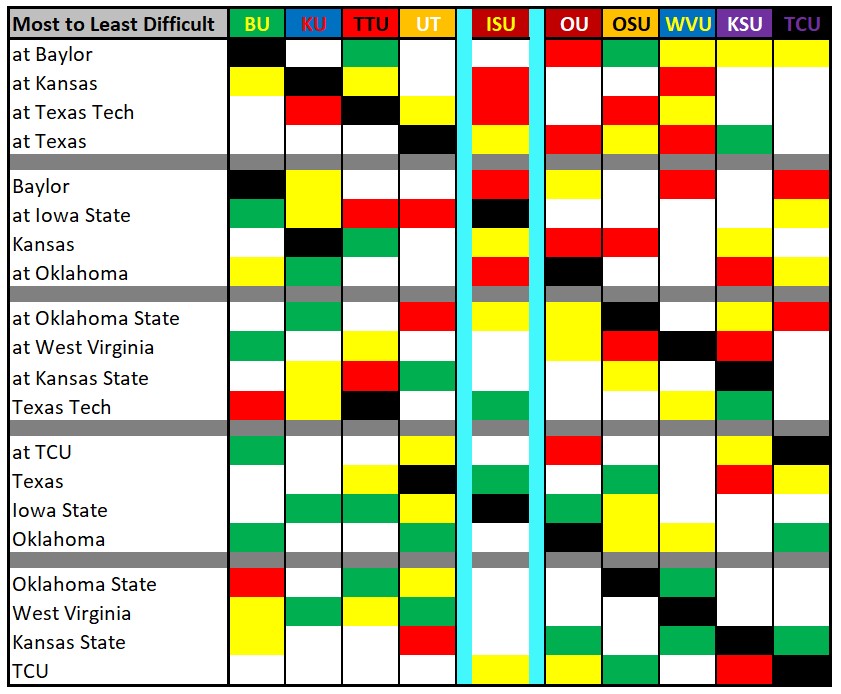
The biggest point here? A ton has been made (including by me) on the difficulty of the first six conference games for the Cyclones but the next four games are not much easier. As we project today, after the first ten games in league play for Iowa State they will have played seven of the possible eight most difficult conference games. That is the bad news but the good news is four games from now, ISU will have seven of their ten “easiest” games to play. This is the breakout by each team showing how many of their last eight games are of easier variety.
ISU 8th in Big 12 Defense
Those that really pay attention to KenPom may have noticed that Iowa State is currently 4th in adjusted defensive efficiency in the country yet on the conference page they are listed as just the 8th best defense in the league in conference games only. How is this possible? Is the defense really that much worse in league play?
Two major things are happening here and both relate to the schedule of Big 12 games played.
First, the conference page with conference results is not adjusted for the strength of competition.
Second, the five best offenses in the Big 12 by the overall adjusted offense or raw Big 12 scoring results are:
- Baylor
- Kansas
- Texas
- Oklahoma
- Texas Tech
Yes, they have only played the five best offenses in the six league games to date. I would expect the raw Big 12 defensive numbers to begin to improve.