Mar 3, 2017; Morgantown, WV, USA; Iowa State Cyclones guard Nazareth Mitrou-Long (15) celebrates with guard Deonte Burton (30) during the second half against the West Virginia Mountaineers at WVU Coliseum. Mandatory Credit: Ben Queen-USA TODAY Sports
March is here and in the last three to four weeks, Iowa State has far and away been playing its best basketball of the season.
A lot of that goes back to the offense and some strides they have made. In my opinion, the early struggles this season were very heavily related to the core guys no longer having a generational offensive weapon (Georges Niang, duh) by their side to make everything a whole lot easier.
This gets a bit into the murky waters of trying to guesstimate correlation versus causation but there have been two key facets for the Cyclone offense as they have improved throughout the season. Below is a chart of all of Iowa State’s games against KenPom top 100 teams in chronological order from left to right.

The dark blue line is Iowa State’s scoring efficiency by game and is set to the secondary axis on the right. Immediately, you can see an overall trend of a steady climb game by game in points per possession scored. It is a small sample size in the grand scheme of things but the trend line verifies the overall ascension of the scoring offense.
The red line is Iowa State’s assist percentage game by game (the percentage of made field goals that were assisted). This was a measurement at the beginning of the season that was often bemoaned by many of us because it had dropped off so much from what we have become accustomed to. In general, assist percentage isn’t needed to have an efficient offense but with the current makeup of this Cyclone team I have long contested it likely needed to be better to reach full offensive potential. The overall trend in assist rate by game is even more dramatic than that of scoring offense. The two are very much related, most likely because of ball movement creating better scoring chances.
Lastly, the light blue line is the game by game percentage of all team field goal attempts that were taken by Matt Thomas or Naz Mitrou-Long from behind the 3-point line. This trend looks similar with the team’s 3-point field goal attempt percentage but can be boiled down to these two guys because they are the primary shot takers from deep. This line is also set to the primary axis as a percentage and again, you can see the trend is going up as the season goes along matching the other two charted lines.
Keep in mind that this is not related at all to if Thomas or Mitrou-Long even make a certain number or percentage from 3-point land, but merely attempting enough shots. It is a given, that the more they make that they are more likely to take more. But, this also illustrates how spreading the defense and playing to their strength—the 3-point shot—can improve offensive output.
Team Scoring Performances
I understand that this is a bit difficult to read, but I wanted to include as much as possible to give the clearest picture possible. This is again only showing games versus KenPom top 100 teams.
Based of KenPom numbers for adjusted offensive and defensive efficiencies for opponents and the scoring that happened on a per possession basis, the chart is broken out into how the Cyclones performed on offense and defense compared to the opponent season average. This is all done without consideration for if the game was home or away.
The blue bar is Iowa State’s offensive performance, the taller the better in each game and an indication the offense beat the opponent’s adjusted defensive scoring average. The red bar is the defensive performance, the farther down the bar goes the better and is showing how far below the opponent’s offensive scoring average that the ISU defense held them. The green bar is the combination of the two to get an objective total performance rating in each game.
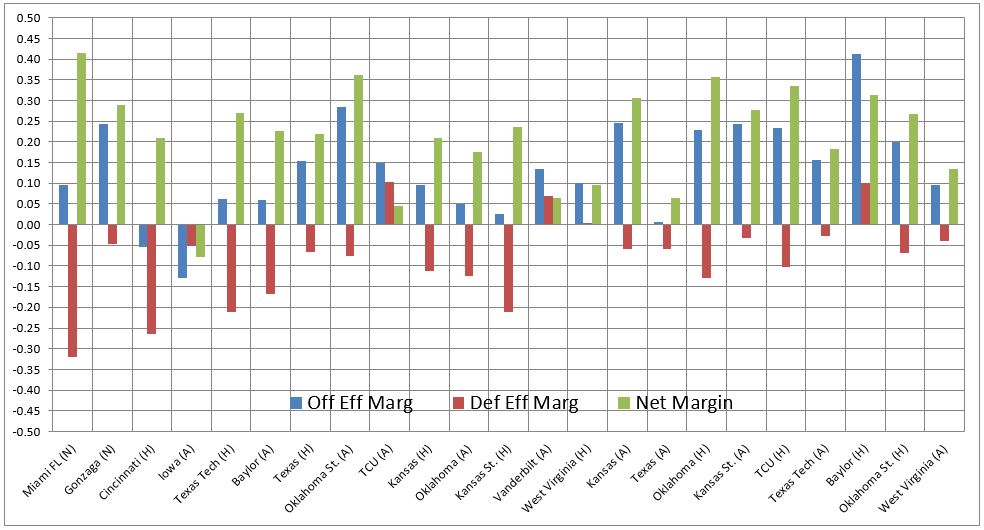
Overall, the offense has been at its best since the game with Vanderbilt, sans the abomination of a performance in Austin. During that time, the defense has still typically held opponents below their scoring average but they have not limited scoring as efficiently as they did in the first half of the season.
There are a few major points to note:
-Only three times this season has the Iowa State defense really performed poorly allowing opponents to outpace their average output. Those games were at TCU, at Vanderbilt, and home with Baylor.
-The best defensive performances came against Miami, Cincinnati, and the home game with Kansas State.
-The best offensive games came in the home game with Baylor, the road game versus Oklahoma State, and the early game versus Gonzaga.
-There have been 14 games since the loss at TCU and really, in all but three of those (at Vanderbilt, home with West Virginia, and at Texas) the Cyclones have performed very, very well. Keep in mind that these numbers are adjusted for the strength of competition.
As the season has progressed, the offense has dramatically improved and while the defense isn’t performing at the same high level, it is still performing well and a much improved unit over the past few seasons for Iowa State.
The overall point being that the offense has improved, the defense is still strong, and that even in losses or poor showings from the Cyclones they outperform what the opponent has done on an average basis with their adjusted scoring offense and defense.