In sports and football, being “close” rarely counts for much of anything substantial but many times it does seem to help peg an overall program to look for areas to improve to turn close losses into victories.
Over at cfbanalytics.com, we have projected every game of the season for every team through our super-secret algorithm, including our Cyclones. The Iowa State projection results in a 3-9 season with wins against UNI, San Jose State, and the Kansas Jayhawks. Of note though, is that four losses are predicted to be by four points or less (at Texas, Kansas State, Texas Tech, and West Virginia).
See the full projections here and pick Iowa State from the drop down.
But those close games have been a bit of a bugaboo since the downward slide of the Rhoads tenure hit in full force in 2013. In that span, Iowa State is just 3-11 in games decided by eight points or less and 3-13 in games decided by 14 points or less.
The hopes of many ISU fans is that Matt Campbell can turn that around; turn close losses into celebrated victories with some smart coaching from the sideline. One of our guys thinking on that plane is none other than local celebrity and leader of the Cyclone Fanatic cult, Chris Williams.
So when he proposed to me to look at what the heck is happening in these close losses, especially from the past three seasons when Iowa State was in the game or leading the game only to unravel, he had my attention.
How bad has it been? Check the table below:
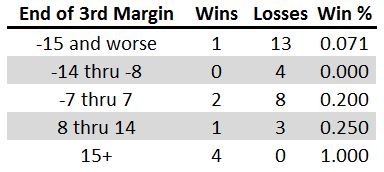
Over the past three seasons, all games are encompassed but broken up into the margin at the end of the first three quarters. Problem numero uno is that of the 36 games played since 2013, there have been 14 of them where the Cyclones trailed by at least 15 points entering the fourth period. One of those games managed to result in a win (West Virginia in the final game of 2013), but the Cyclones were down by 17 points at the start of the fourth quarter.
It is at least a little surprising that the Clones haven’t won any games when trailing by eight to 14 points but those games include the heartbreaker at Toledo in 2015, the TCU collapse in 2015, the methodical beat down from Iowa in 2013, and the brutal opener in 2014 against NDSU.
Maybe the worst news of all, though, is that when games have been a one touchdown game headed into the fourth quarter, either trailing or with the lead, Iowa State is just 2-8. One win was at Iowa in 2014 and the other at home against Toledo in 2014. There are some painful losses too, such as Texas Tech, Texas x2, West Virginia, etc…
That’s the bad news, but the depressing news is that there have been four occasions in the past three seasons where Iowa State had an eight to 14 point lead after three quarters, and they only won once. Two of those losses came last year to Kansas State and Oklahoma State while the other was Kansas State in 2014. The lone win was the home opener against Tulsa in 2013.
That’s the overview, but what is happening? To take a look let’s analyze the 17 games where ISU trailed by seven or less or had the lead by as much as 14 to end the third quarter.
First off, Iowa State was one of four FBS teams in 2015 to win zero games that were decided by seven points or less while playing at least three games that fell in that margin. ISU and three of the other teams played in exactly three games within that margin while losing them all (Arizona State, Purdue, and Troy). But, at least we weren’t Army who went a whopping 0-6 in games decided by seven points or less!
Below is a chart of the 14 games in the past three seasons where Iowa State’s margin entering the fourth quarter was somewhere from negative seven to a 14 point lead. Left to right on the x-axis, it goes from largest deficit to largest lead and is depicted with the bars and tied to the y-axis on the right side of the chart (the two games in the middle with no bars were tied after three quarters). The three green bars were the games that resulted in wins.
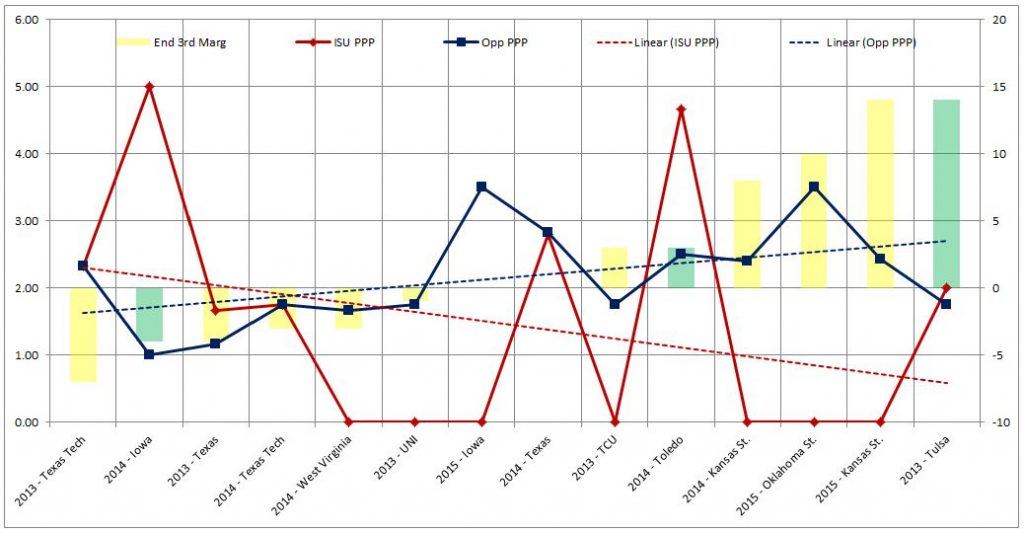
The primary issue here – where we’re showing the points per possession scored by Iowa State (solid red line) and opponent (solid blue line) – is that there are seven games where the Cyclones completely failed to score in the fourth quarter while opponents have never suffered that fate. There are just four games where ISU outscored the opponent in PPP in the final stanza and three of them resulted in wins.
Then to the trendlines where the issue really stands out; as Iowa State’s lead entering the fourth increases their scoring efficiency in the final period very much slopes downward while opponent scoring very much slopes upward. The offensive scoring goes off the rails and the opponent scoring goes full steam ahead.
All told in these 14 games Iowa State averaged 1.20 ppp while their opponents averaged 2.18 ppp. That’s a problem. The FBS average for points per possession scored for all of 2015 was 2.13, in these examples, the offense is letting the defense down much more than the opposite.
If you dig a little deeper two more things become very apparent. The first is that when you look at turnovers, there really isn’t much of a difference between Iowa State and their opponents. That was one of my initial guesses as to what was going on. There is some slight game to game variation and in games where the Cyclones blew the biggest leads they lost the turnover battle decisively, but in the grand scheme of things it doesn’t appear to be as large of an issue as overall offensive movement.
The below chart is setup the same as the above graph but it is looking at average yards per play in the fourth quarter instead of points per possession. Using yards per play does have some flaws, but it is by far the simplest and most accurate way to measure all-encompassing ball movement.
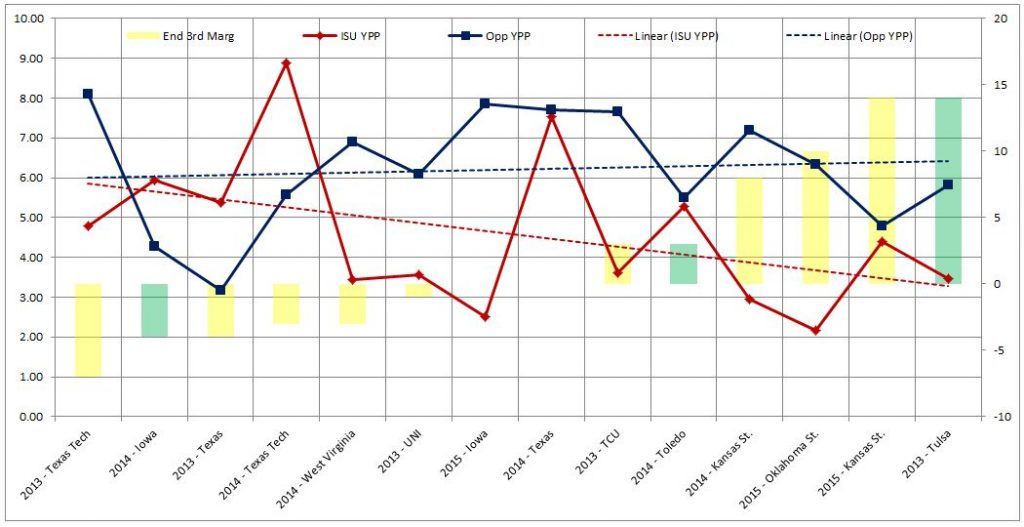
Once again, you’ll see that Iowa State’s fourth quarter performances tend to go in the tank as their lead is increased at the start of the period, while the opponent numbers stay relatively flat. That could be due to a variety of things but there are two primary contenders for reasoning that come to my mind. The Cyclones are most likely either, a) failing to make adjustments to what the defense is doing or, b) completely packing it in and playing conservatively.
In these 14 games, the Cyclones are averaging 4.56 yards per play while opponents are racking up 6.21 yards per play. That is also a problem.
After a bunch of words, numbers and charts, I think the most relevant conclusion is this: Iowa State has failed massively at winning close games when it comes down to the final period, whether that be due to coaching adjustments and strategy, execution, or fatigue and the offense is the prime suspect, not the defense. The defense has given up chunks of yardage but end the end they have done well enough for wins, in most cases.
Whether it is yards per play variances from what would be expected or drops in scoring efficiency by PPP, the offense isn’t pulling the weight it needs to.
Testing CW’s Turnover Theory
Our main man, Christopher Williams has also been stating on the radio lately that he believes that in years where ISU has a more respectable scoring defense it is mostly due to turnover creation; and the main defensive problem the past few seasons has been the absence of turnovers. I’ve tended to hold that same position as him, but to please him and test it out I wanted to put some historical numbers together.
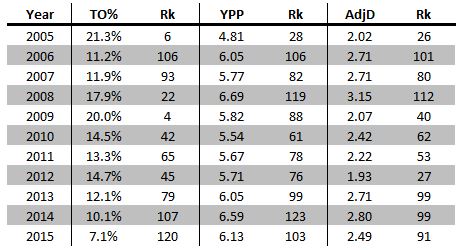
Behold a bubble chart! The y-axis is Iowa State’s total AdjD from cfbanalytics.com for each season back to 2005, the x-axis is the yards per play that they allowed on average, and the size of the bubble relates to the percentage of possessions where the defense forced a turnover. In short, the lowest bubbles relate to the best scoring defenses, the bubbles furthest to the left are best in yards given up, and the biggest bubbles show the most turnovers forced. Inside each bubble are labels with the year and the actual value for the percentage of possessions with a forced turnover.
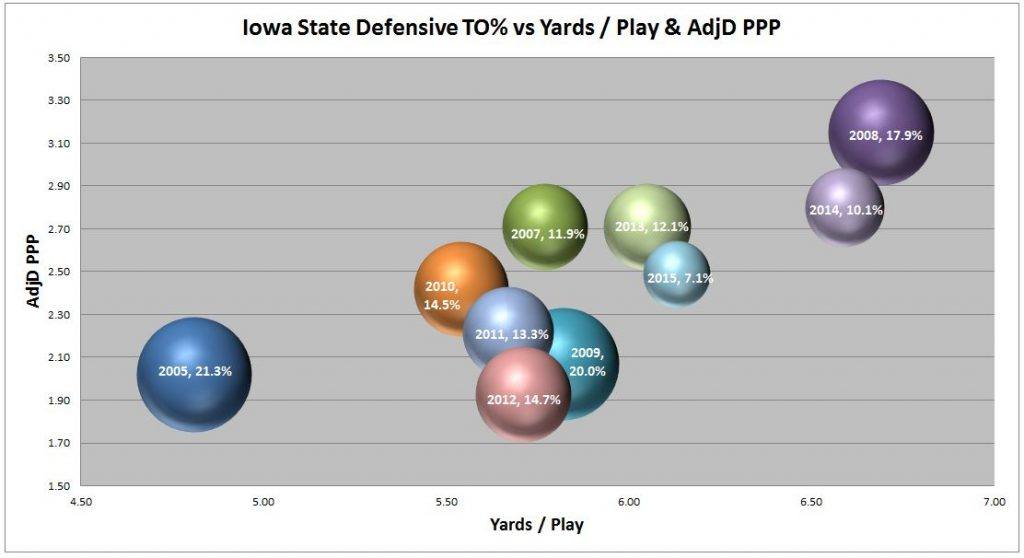
This is your reminder of how good that 2005 defense was even if aided by playing a schedule that wasn’t yet completely full of elite offenses. That defense limited yards and scoring with the best of them while creating turnovers at the highest clip in the chart.
The four best teams of the Paul Rhoads era are all clustered near the lower middle of the chart and roughly equal in yards and scoring allowed but you can see that the 2009 defense really lived off of turnovers.
The 2008 defense is a prime example of how turnovers can’t overcome everything. They were 22nd nationally that season but still abysmal in yards and points allowed at 119th and 112th respectively.
Below is the table of data tied to the chart: