It has been a common point of wonderment for Cyclone fans recently for Paul Rhoads and Iowa State; has Rhoads lost his edge and chutzpah when it comes to rolling the dice and playing aggressive? This has been most notable in fourth down circumstances for his offenses.
When you look at the situation simply you end up with a chart like the one below. A chart that breaks down how often Rhoads opted to try and convert on fourth down as well as the frequency of punts, field goals, and successful conversions.
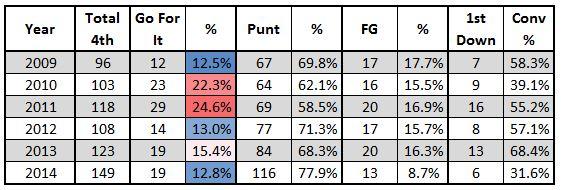
Of course, without more contexts this isn’t really all that useful. The most noteworthy thing to me is that while 2014 was very low for Iowa State by frequency of fourth down attempts, if falls very closely in line with three of the other five years. It’s just that in two seasons the attempt frequency was essentially doubled.
But if you really want to dive into this other considerations must be made. What was the distance to go on fourth down? What kind of field position was the offense in when the decision was made? What was the score and time left in the game situation?
In all honesty, it is almost too much to consume and communicate in one short blog post and because there are so many variables the sample size gets really small when we’re only looking at six seasons in total. But, I tried anyway to get some clarity on the matter.
For this, I chose to focus on the distance to go and the field position and to focus solely on the decision to go for it on fourth down and not if it was actually converted. Going down the far left column, you’ll see the down and range of distance paired with the field position in parentheses (distance to goal line for a touchdown so that “90” = the offenses ten yard line).
I realize this looks a little messy but I wanted to try and convey some information on the topic and this is the just scratching the surface since time and score wasn’t even factored in as we look at six different seasons across the top. For each season, there is a count of the times the team faced a fourth down with the give down, distance, and field position. Then the percentage was calculated for the frequency in that situation that Rhoads elected to attempt for a first down.
In each field position range for each season, I summed up the total fourth downs faced, attempted conversions and calculated the percentage of times the conversion was attempted regardless of distance for that field position. Also, for the frequency of attempts by distance and field position I formatted them from white to red for most frequent attempts at converting for a first down.
Still with me? It’s not complex, yet it is when trying to account for so many scenarios and then walk through how and what things were done. There are three charts below and each has three 10-yard chunks of field position while everything inside the offense’s 10-yard line was ignored.
The Iowa State 11-yard line to the Iowa State 40-yard line:
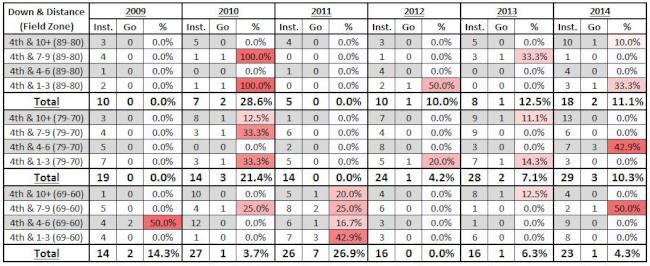
The first thing I noticed was that in 2011, the Cyclones went for it very often from the 31-yard line to the 40 yard line and 2010 dominates the other two zones of field position on this table. All of that said, in 2013 and 2014 Iowa State still attempted to convert fairly often. Certainly not the major drop off that I would’ve thought based on my observations.
From the Iowa State 41-yard line to the opponent 31-yard line:
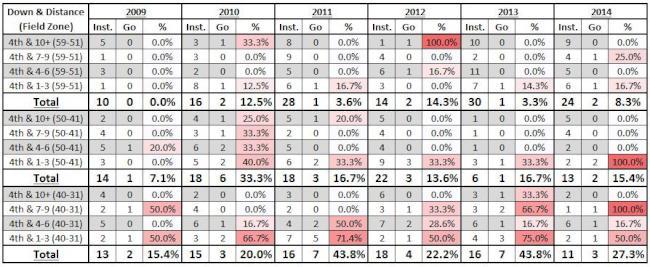
Here the distribution of frequency of attempts across the six seasons is decently uniform but the 2010 and 2011 seasons specifically had far more drives stall out in this area of the field than the 2013 and 2014 seasons. In the 20 yard zone between the 40-yard lines of the field the 2010 and 2011 teams faced 67 fourth down situations. In the past two seasons? 46.
That alone can be very deceiving in our perception of how often Rhoads elects to try and convert for the first down.
From the opponent 30-yard line to the goal line:
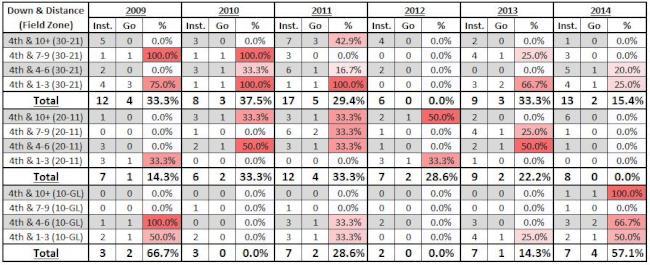
There is no doubt—and this is probably the most noticeable to us—that the last two season of Iowa State football has rarely gone for the conversion from the 30-yard line to the 11-yard line of the opponent as compared to the 2010 and 2011 teams. And that is especially true for the 2014 Cyclones.
Yet, inside the 10-yard line, the 2014 Cyclones went for it more often than every team except for 2009.
Aside from the variables of the situation that I mentioned above, there are other major things for the coaches to consider. Can your defense bail you out in the middle of the field if the attempt fails? Do you have faith that your offense has something working well enough to gain the needed yardage? Is there a fake punt or field goal in your pocket that you have high confidence in?
Also, some of this data could likely be flawed if the game was a complete blowout and essentially already over.
In short, there is a bit of drop in fourth down attempts recently for Iowa State. There are also spots where the Cyclones continue to go for the first down at a relatively high frequency. In some cases, the large variance in chances to go for it on fourth down can play a few tricks on us and what we’re seeing on the field.