

Over the next 16 days the schedule for Iowa State gets pretty interesting. There’s a home game with Texas and two road games against other Big 12 contenders, Kansas and Oklahoma. But, maybe the more interesting part is that all three of those games are a part of the Big Monday festivities on ESPN.
That means quick turnarounds to Monday, which can get interesting when combined with the travel. With all of that noted, the question was posed to me on if I could pull some data together based on the Saturday to Monday swing and how teams fared in those games.
I was happy to oblige the best that I could to come up with a few things to share today. I used my database that I’ve built every year since the 2011-12 season to form all of this analysis and only included games from Big 12 conference play. It also only used situations where a team played on Monday and played a conference game the Saturday two days prior.
I hemmed and hawed and hemmed some more on displaying the data in the most meaningful yet simple way but in this instance, keeping it simple was the only real way to keep it clear. I have the Monday games separated into four categories H – H (Home on Saturday – Home on Monday), A – H, H – A, and A – A to look for the most favorable circumstance to win the Monday games. (Keep in mind, some of these Monday games aren’t the actual “Big Monday” but also the 6 pm time slot on Monday in some situations.)
It would probably be unanimous that playing home – home would be the most advantageous circumstance and away – away would be the worst. The two scenarios in the middle would be up for debate in some ways, but in the end we’re just looking at success on the Monday game so being at home for that is the obvious advantage.
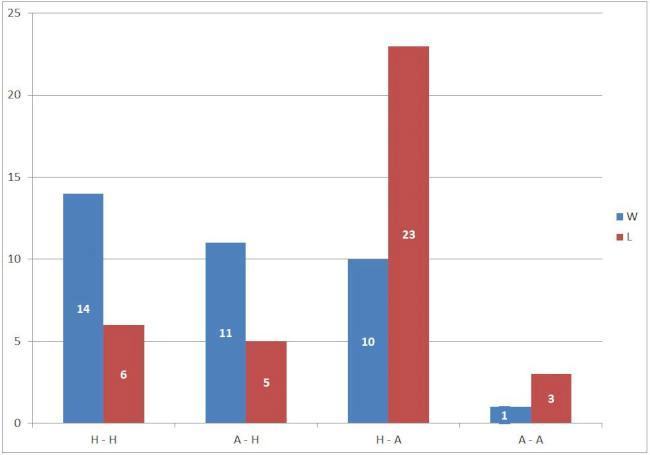
(Note: there are an odd number of games because in 2013 before Baylor played a Monday game, their Saturday game was against Hardin-Simmons (perhaps a cousin to Huston Tillotson?) and not a Big 12 opponent.)
The above breaks out the wins (blue) and losses (red) by those scenarios. The main part the jumped out to me was how many of the games have been played by teams in the home – scenario which I have to believe is largely a product of trying to avoid teams doing back to back away games.
If you know me, you know I prefer to drill down further. So I did.
For the same time span in each given season, each team was assigned the seed that they eventually earned for the Big 12 Tournament at the end of the conference season. Then, for each game they played I subtracted their opponent’s seed so that I’d end up with a number from -9 to 9 (except 0). This gave me a method to somewhat break out the games by if a team was expected to win or not.
If a team’s seed differential was five or more they were considered the favorite (Fav), if it was negative five or less they were considered the underdog (Dog), and everything in between was a tossup (Toss). You can then look at each team through the lens of their Monday game and if they were expected to win and tie it together with the travel and home court situation. The chart below shows the winning percentage (blue bars) for those Monday games for the teams in the given situation and the total number of games for that situation (red line and the y-axis on the right).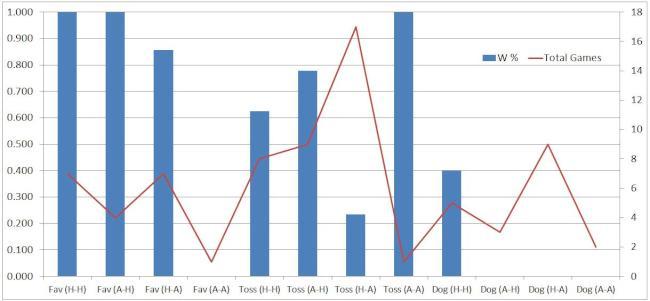
There isn’t as much to derive from this as I originally expected but I did take note of the tossup games and the difference in winning percentage from H – H to A – H.
Lastly, I thought it was relevant and easier to understand if we looped it back to each Big 12 team’s performance in these three seasons. That shows their home and away Monday game results in Big 12 play after playing a conference game two days prior.
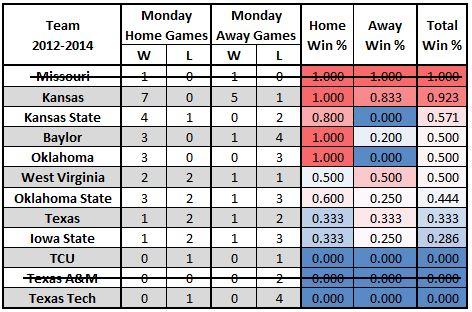
The numbers there aren’t so great for Iowa State, but that is in part due to the two home losses…and I think we know who those losses came against (Kansas).
For the fun of it, I did compare those Cyclone numbers back even further. From 2012-2014, in conference play you can see above that ISU had an overall winning percentage of 0.286 and a road winning percentage of 0.250. To compare, I went back to 1989 where Iowa State has only 20 total conference games on Mondays and nine of those have been away from home. Overall the Cyclones in all Monday games back to 1989 in conference play are 5-15 (0.250) and on the road they are 2-7 (0.222).
That pretty well falls in line with recent history.
If Iowa State is to contend for a Big 12 title this season, it will need to find a cure for its “case of the Mondays”.


