
I don’t really know why but for some reason, “bench points” is a thing. Something that is tracked and pontificated on and usually updated throughout the game. I suppose the rationale is obvious, even if misguided. I mean, if a team has reserves outscoring their opponent’s then they must have more players that are “better” and a leg up on the competition.
Only, it doesn’t work like that. As it turns out, the only thing that matters is that someone on your team scores points and the other team’s players do not score points. Usually, a team’s best players start the game so it stands to reason that the best players have more to do with the outcome of the game.
Yet, here I am proving that bench points aren’t really important. This is obviously in retaliation to the Cyclone naysayers and their lack of depth. Which, by the way, Iowa State does lack depth in some ways but bench points is certainly not the best measurement system.
(Side note: If one more person cites Georges Niang foul trouble as a reasoning for Iowa State’s lack of depth, I will lose my ever-loving mind. “Wait, you mean a team may not perform as well when their best player and first team All-American candidate isn’t on the floor??” Which team in the country is that not true for?)
*Note: All stats and facts listed exclude the Baylor at Oklahoma State game from 1/27/2016.
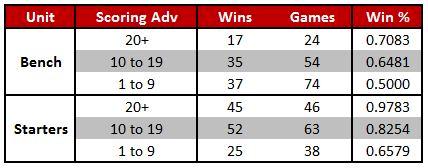
Anyway, to the meat and potatoes…I looked at every game played this year by a Big 12 team and compared the scoring advantage in the game broken out between the starters and the reserves. I separated the margins into categories and compared the winning percentages. I think the results basically speak for themselves:
But, it is pretty clear to me that bench points are less tied to winning than points from a team’s starters.
And, no, you don’t want to know which team lost when their starters outscored the opponent’s by more than 20 points…
Another note on depth as it relates to Iowa State; the Cyclones give bench guys the 344th fewest minutes in the NCAA (out of 351 teams) but, the quality of depth that they have in the first five guys is very, very good. That is especially true with the number of Cyclones that can put the ball in the hoop.
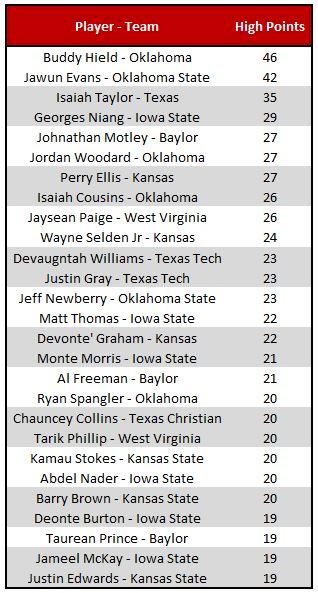
To the right is the list of all of the Big 12 players that have a high scoring game of at least 19 points in conference play. In total, there are 27 players that have managed to do that this season.
But, what is interesting is that when you break it out by team how many guys for Iowa State have done this compared to the rest of the league. Six of them. Meanwhile Oklahoma has four and a few others have three; half of the number that Iowa State has posted.
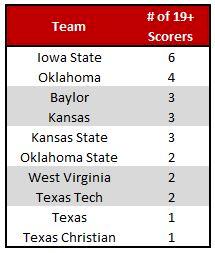 So the great depth as far as guys that can log minutes isn’t really there but the quality of scoring depth in the top six of the rotation is probably the best in the Big 12; and that is saying something.
Niang’s Turnovers
A couple of weeks ago I raved about some of the offensive improvements of Georges Niang this season and how much of that was directly related to his career best turnover numbers to date.
His season long turnover rate is still the best of his career but it has certainly taken a hit in the last five games.
In the first 15 games of the season he registered just 25 turnovers, in the last five games he’s notched 20. Through the first 15 games he turned the ball over on 2.8 percent of the possessions that he was on the court, but in the last five games that number has been 6.2 percent.
A good chunk of those have been weird turnovers or odd offensive fouls, but nevertheless, it is a number to keep an eye on with measuring his performances and overall efficiency.
Creating possessions
I’m pretty well fascinated by teams that “create” more possessions. Possessions are so valuable for obvious reasons because they give your team extra chances to score. In the chart below, the possessions per game isn’t the true possessions per game because the formula for possessions subtracts out offensive rebounds. So in this case the number is more, “average chances to get a shot off” because I did not subtract offensive rebounds out of the estimation.
Anyway, the idea here was to compare which teams “create” more possessions than their opponents by grabbing offensive rebounds, forcing turnovers, preventing offensive rebounds, and avoiding their own turnovers.
The column with “Gained / Poss” is the given team’s offensive rebounds and opponent turnovers divided by the possession number next to it. The “Lost / Poss” column is the opponent’s offensive rebounds and the given team’s turnovers divided by the possession number.
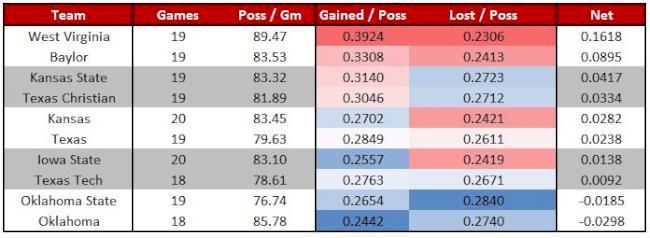
Part of the reason this is so interesting to me is because all of the extra chances teams like West Virginia and Baylor can create and to look more closely at Iowa State’s method. The Cyclones typically force very few turnovers and rarely grab offensive rebounds so you’d expect them to be hurt here. But, they also do a very good job at avoiding turnovers and preventing offensive rebounds.
Thus, the Cyclones actually come out okay when you run the net possessions created. But, my word, look at West Virginia doubling up the second best team and quadrupling the third best team. That’s crazy.