
Feb 16, 2019; Manhattan, KS, USA; Iowa State Cyclones guard Lindell Wigginton (5) is guarded by Kansas State Wildcats guard Kamau Stokes (3) during the first half at Bramlage Coliseum. Mandatory Credit: Scott Sewell-USA TODAY Sports

Forgive me and my busy schedule, but this week will be heavy on the data/graph dump and light on the words. In truth, that is in part because the information I’m sharing is interesting but I can’t say that I’ve unlocked the “why” behind all of it, for the most part.
Lineups, lineups, lineups
Below is lineup data for conference games plus the game at Mississippi. As I’ve stated before, this does need to be consumed with caution. It is different than individual plus-minus (which is essentially useless) because of the level of detail that goes into it but at the same time there are so many combinations that the sample size is typically too low and it is still susceptible to random variance that is typical in every game.
The most frequent lineups at the top. While the starters are way ahead of the rest of the field I’d suggest that is the case more because of standard substitution patterns than because of some strong preference for that lineup. The many combinations of lineups after the starters is just a product of working in two to three guys from the bench and gradually working back to the starters.
The efficiency margin (EM = PPP – Opp PPP) is color coded from red to white for most effective scoring margin to least.
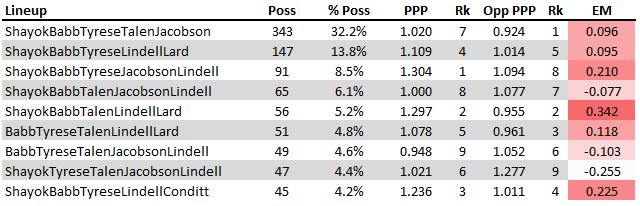
What the data suggests is that the lineup featuring Marial Shayok, Nick Weiler-Babb, Talen Horton-Tucker, Lindell Wigginton, and Cam Lard has been the best option for Steve Prohm. But that is only over the course of 56 total possessions (not even a complete game) The interesting part with this lineup is that it has built that EM based off multiple games of short stretches and not one or two games with major scoring runs.
I’ll let you draw your conclusions, but my main takeaway from this is that we’re starting to see the emergence of Wigginton and Lard in many of the best lineups by EM.
Individual scoring by lineup
One other part with this information that I wanted to look at is how do different players score based on the lineup they’re playing with.
Below is the same list of lineups as from above, but in each row, there is a column for each of the top seven guys and that column is shaded red to white based off their individual points scored per possession in that lineup. There is a lot of wiggle room in that but it is the simplest way to look at it and probably directionally close.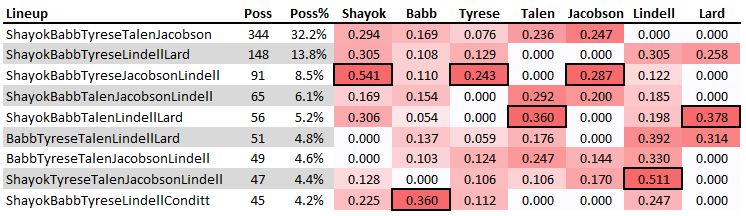
Again, the sample size is a factor just because the sheer number of possessions for the starters makes that lineup more difficult to have scoring at such a high rate.
The thing that jumps at me is the third most used lineup has three guys scoring their highest rate. Tyrese Haliburton, Michael Jacobson, and Marial Shayok all score their heaviest when they’re on the court with Weiler-Babb and Wigginton.
Scoring by time
Another useful way to look at this data is to look at how the Cyclones perform as the game goes along. Again, sorry for the lack of not attaching narratives to the information, but based off the numbers and my eyes I’m not convinced I have the answers as to why the scoring is the way it is.
This is the last 16 games broken out to show ISU scoring and their opponents by four-minute segments of the game. It is in points per game within that four-minute time frame because that seemed more tangible than PPP over such a short stretch. But the blue line does show the tempo as the game goes along with the secondary y-axis.
As expected, tempo stays pretty level until the final four minutes where fouls become an influence.
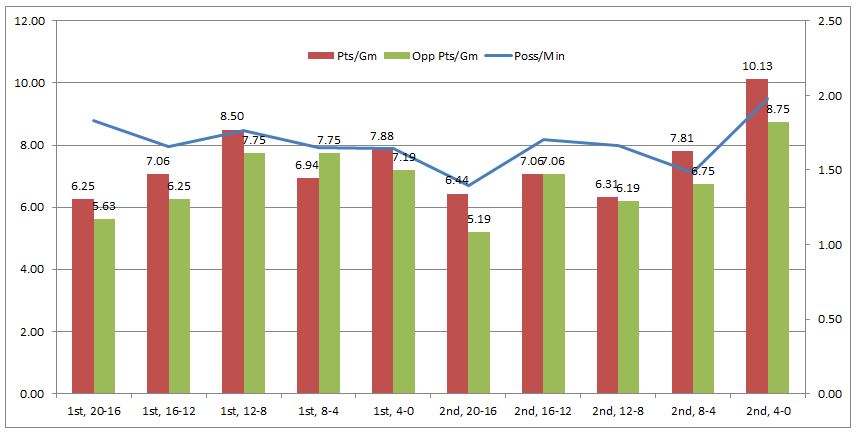
Iowa State is a team that has won more than it’s lost and in the games they have lost they have typically been close games, so it isn’t a surprise that in each four-minute window the Cyclones tend to be even or ahead of their opponents.
The lone exception to that trend is in the first half from the eight-minute mark to the four-minute mark where they’re outscored by almost a point per game on average.
Is this due to a lull hitting after a lead, or the opponent settling in, or the lineup they happen to land on after subbing a few times, or pure random variance?
It is encouraging to me that the Cyclones have the advantage at the start of the game, the end of the first half, and to open the second half. That would suggest some positives from the coaching staff but like I’ve said you could probably shoehorn most any preferred narrative to fit this data.