


Karl Chevrolet gives you peace of mind when you purchase a GM Certified Pre-owned vehicle. We have been the #1 GM Certified dealer in the nation for 10 consecutive years. Before you make your next purchase, come see why more people nationwide drive a Karl Chevrolet Pre-owned vehicle than any other dealer-There is a difference, Come see why TODAY!!
We love to try to find indicators to affirm opinions and make predictions based on history and trends. One of the main correlations people will make is with narrowing the teams most likely to win the NCAA tournament (or make the Final Four) based on being in the top 20 of KenPom’s adjusted offense (AdjO) and adjusted defense (AdjD).
It’s a fine thought, but the problem with it is that it is often used post tourney after these teams have reeled off at least four wins with usually two or three of those wins against pretty good teams. So, it is a bit of a self-fulfilling prophecy in that manner. Aside from that, in the past five years it hasn’t been consistently true.
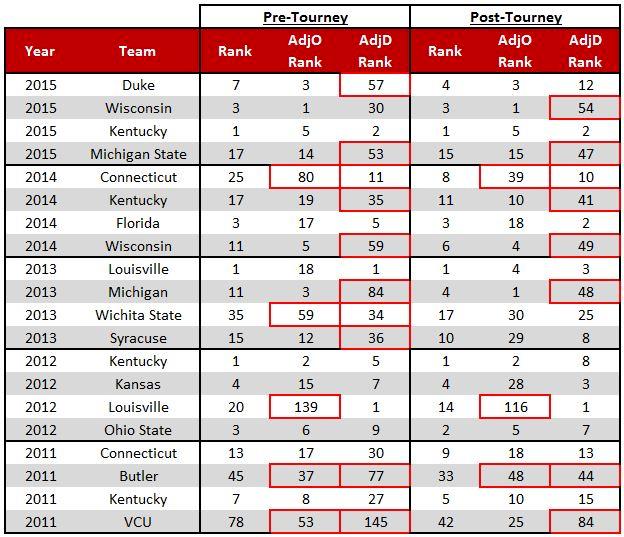
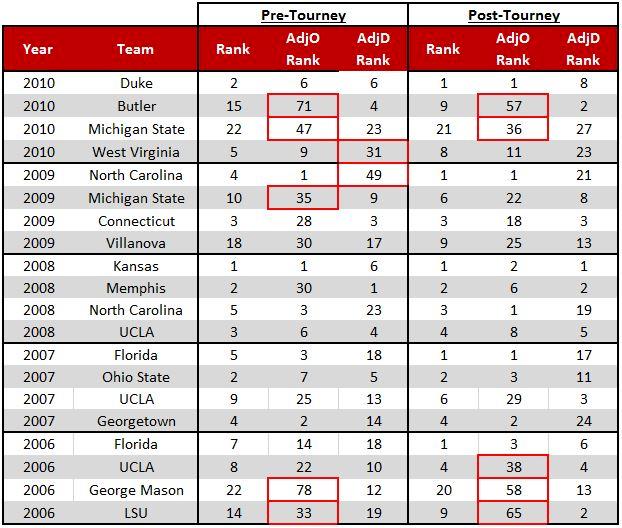
The good news is that in the past couple of years the data for teams pre-tourney was made available so we can actually look at these things retroactively. I sorted through the past ten seasons and listed each team’s rank, AdjO, and AdjD from before the NCAA tournament and after. The champ for each season is listed first, followed by the runner-up, and then the two other semifinalists.
Any number with the red box is outside the top 30 in the given category.
And, the summary of all of that data:
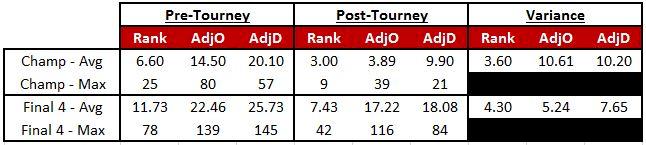
“What’s the point?!?!”
Here’s the point…we try so hard to correlate what we see and what we think we know with trying to predict on a chaotic 68 team single elimination tournament. The problem with that is the obvious but also that just predicting basketball games alone (see below) is difficult enough.
It seems to me what many don’t really realize or want to admit is that game results can be awfully fickle. If you think about it, games are basically a contest of which team can get more high quality shots than their opponent (of course the shooting capabilities of your guys matters too). But even then, sometimes bad shots go in and good shots don’t. So trying to correlate every last little thing to predict the four regional champs by rough guidelines and qualifiers seems useless.
PARITY!
Parity is the word you’re hearing about throughout college basketball. But, does it shake out? I was intrigued by some things I saw so I dug in a little bit. I used KenPom’s Pythagorean Theorem calculations (the value in which he ranks teams off of that predicts each team’s win percentage if they played against an average team based on their adjusted offensive and defensive scoring efficiencies). Whatever you think of the rankings, this is a pretty fair way to compare year to year in overall quality of teams in college basketball.
I bucketed each team’s calculated pyth in to groupings of 0.05 increments iand made a histogram.
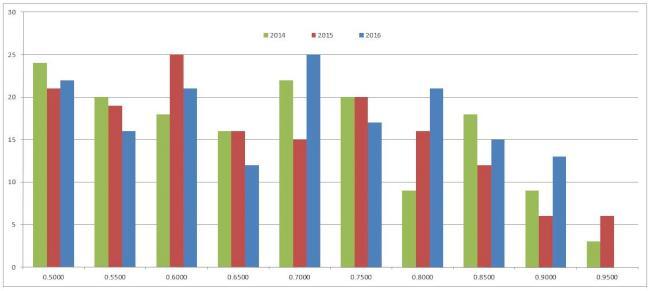 2016 is in blue, and you’ll notice for the bucket of teams with a pyth of 0.95 or better there are no teams (y-axis is just a count of total teams). But look at how many more teams comparatively there are in the next three groups working to the left compared to the last three seasons.
There are fewer (or no) elite teams this season but if you compare the total number of teams with a pyth of 0.8000 or better the breakdown looks like this:
2016 – 49
2015 – 40
2014 – 39
Whether “parity” is the exact correct word to use, I’m not sure. But there are fewer elite teams yet more teams total at the top of the pyth values.
Niang Numbers
Any basketball blog post on Iowa State this week would be incomplete without a blurb on Georges Niang. This will just be a blurb as I’m sure I won’t be able to stop myself from a sloppier, mushy, ode to the senior in the next few weeks. But, I wanted to bring attention to what he has done in Ames and how his legacy stacks up with previous Cyclones.
Niang is currently third on the all-time scoring list now with 2,014 points but I think we all realize that while he is a great scorer, longevity plays a role in that too. So how do his game averages stack up?
For his career, right now, Niang is averaging 15.6 points. Here is the complete list of guys that have averaged 15+ points per game for their career in Ames while playing at least three seasons:
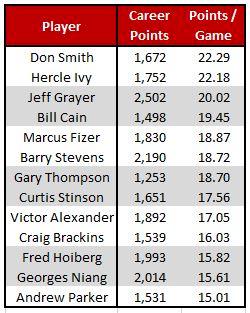
The scoring is great, but he’s also done so much more. He also has averaged 5.14 rebounds per game and 3.0 assists per game to go with his 15.6 points per game. Here is the complete list of guys that have averaged 15+ points per game, five or more rebounds, and three or more assists as Cyclones:
Curtis Stinson: 17.6 ppg, 5.6 rpg, and 4.8 apg.
DeAndre Kane: 17.1 ppg, 6.8 rpg, and 5.9 apg.
That’s it.
Also, he’s the only Cyclone in history to average 15+ points per game in his career while winning more than 60 percent of his conference games while playing at least three seasons. Niang has now won 61.2 percent of conference games in his career. The only other Cyclone in that realm is John Crawford also at 61 percent but he averaged 13.4 points per game.
Not a bad career so far for Mr. Niang, let’s hope he can go out with a bang.


